
OK, you’re ready to start tracking theoretical versus actual costs in MarginEdge – awesome! So, how do you get started? First step - doing the PMIX Mapping for any ingredients you want to track.
This article will walk you through the basics of PMIX Mapping. There's also an intro webinar you can watch and we also offer a Theoretical Reporting Setup Service if you want one-on-one support!
* If you need more context, please read this: Getting Started with Theoretical Usage Reporting
OK, so what is PMIX Mapping?
PMIX Mapping - short for Product Mix - is the process of associating your POS buttons with products or recipes in MarginEdge. When will you connect a POS button to a product versus a recipe?
PMIX Mapping to Products:
This is done when items you ring-up in the POS correspond to the products you purchase. This is common for beer, wine, and often liquor. For example, you may have a POS button labeled “Sam Adams Lager Bottle”, and in [me] you would associate that with the product “Sam Adams Lager Btl”.
PMIX Mapping to Recipes:
This is done for your menu items or any items you ring-up that are made of multiple products (i.e. multiple ingredients). For example, you may have a POS button labeled “Salmon Dinner”, and in ME you would first create a menu item recipe for “Salmon Dinner” and then associate the POS button to the recipe of the same name.
(Note: in the example above, you can create the complete menu item recipe for “Salmon Dinner”, that pulls all the appropriate prepped recipes into it, OR you can create the recipe with just your highest priced ingredient – Salmon – and just begin immediately tracking your Salmon theoretical v actual usage!)
WEBINAR SUPPORT - Theoretical Reporting and PMIX Mapping Intro Webinar
This webinar is a brief introduction to theoretical reporting setup and PMIX Mapping. This introduction will start with the basics of unlocking menu analysis and theoretical usage reporting.
PAID SUPPORT - Theoretical Reporting Setup Service
If capacity and timelines are tight, our product experts can provide an extra hand, getting your account set up quicker, without sacrificing you or your team’s capacity. With this consulting package, one of our industry experts will provide the training and support your team needs to finish your POS setup and start running theoretical reporting. Here’s what our Theoretical Reporting Setup Service can do for you:
- Set up and Review package: Through a series of three 45 minute 1:1 calls, we’ll help you map all of your products and recipes, review our work together, and train you and your team on how to manage the mapping moving forward | Price: $250
- Mapping for Add-on Units: If you already have your PMIX mapped at one unit, we can maximize your efficiency and copy the mapping to your additional units | Price: The cost is calculated based on the number of lines copied from the original unit
Get your questions answered here: Theoretical Reporting Setup Service
Want to get started? Contact services@marginedge.com for more details.
LET'S DIVE RIGHT IN! PMIX Mapping Orientation
The PMIX Mapping screen is found by clicking Accounting > PMIX Mapping from within the MarginEdge main menu. On your first visit to this screen, it will look something like below, with labels shown in the Major column and numbers in the Quantity and Sold columns:
FIRST: Setup Category Types
Before you start mapping POS buttons to products and recipes, you must first setup Category Types (Food, Beer, Wine, Liquor, NA Bev, Retail & Other) for all PMIX Product Groups coming in from the POS.
To do this click on the PMIX Setup button. On the PMIX Setup page, for each line, double-click the field in the Category Type column and select the correct category. Be sure to use the “Save Changes” button when finished.
For step by step instructions on this, see this article.
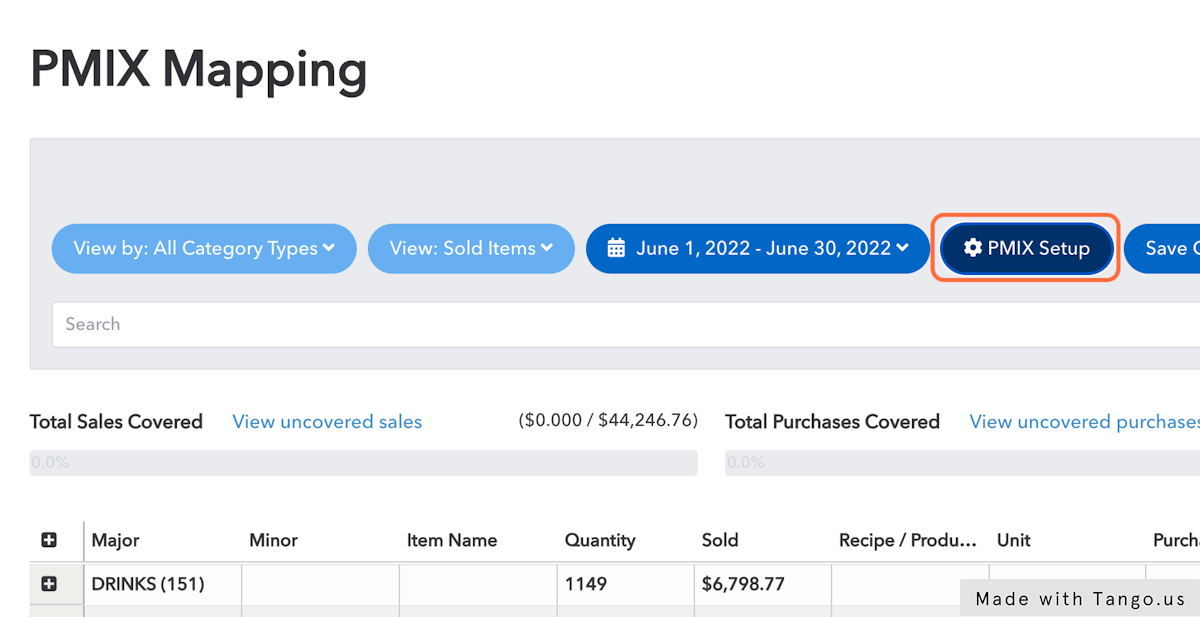
Orienting to the PMIX Mapping Screen
Along the top of the PMIX Mapping page are the following additional buttons:
View By:
Once you have associated your POS categories to MarginEdge Categories (Beer, Wine, Liquor, Food, NA Bev, Retail Other), you can change the view on this page to only a selected category.
View Sold or All Items:
By default, this screen displays only POS items that were sold in the date range selected. Depending on your POS system, by clicking “View All”, you may be able to view all items from the POS regardless of whether there were sales in the date range selected. Some POS systems do not provide this.
Date Selector:
This will default to the current period. However, when you are actively working on this, we suggest adjusting this to ensure you are seeing as many POS buttons as possible. Select from this menu to widen the date range to many months or even a full year to ensure you are seeing even those items that sell very infrequently.
PMIX Setup:
This is used at the beginning of PMIX Mapping to associate your POS categories to MarginEdge Categories (Beer, Wine, Liquor, Food, NA Bev, Retail Other). For more detail, see the section above (Setup Category Types)
Save:
Save any mapping changes you have made on this page.
Export:
This will let you export PMIX mapping details to either CSV or PDF.
Understanding the Data Grid Displayed
In the main grid, you will be doing the “mapping”: selecting a product or recipe for each POS item for which you have sales. These are selected by double-clicking the fields in the "Product/Recipe" column. The other field that is editable is the “Scale” field. That and all other fields are described in detail below:
Major / Minor / Items
Information on the left side of the screen is coming straight from your POS. By default, the screen shows Major categories, but these can be expanded by clicking the “+” symbols so you can see the Minor categories (if they exist in your POS) and the individual items from the POS. The items each correspond to a selection/button in your POS. Click the “+” next to the word “Major” to expand all sections at once.
Important Note: By default, this page shows only POS items that are sold in the date range selected. To ensure you are seeing as many POS buttons as possible, widen the date range to many months or even a full year to ensure you are seeing even those items that sell very infrequently.
Quantity / Sold
The quantity and dollar amount representing how much of that POS line item was sold during the period chosen with the date selector at the top of the page.
Recipe/Product
Used to select a Product or a Recipe to connect ("map") to a POS line item.
Unit
This is the reporting/inventory unit associated with the product or recipe in MarginEdge. This cannot be edited from this page. Changes can be made by editing the Product or Recipe itself.
Purchased
The dollar amount of purchases associated with the Product chosen. When a Recipe is selected, no dollar amount will be shown for Purchases.
Scale
Used when the POS item is a fraction of the quantity purchased of a product. Common example: kegs of beer. The POS item may be “Stella Artois 12oz Draft”, but the product to be mapped is “Stella Artois Keg 1/2BBL”. The scale will be the 12oz as a fraction of that keg size. A chart of common scales used for beer, wine and liquor can be found here
SECOND: Try your hand at mapping
High Value / Top Sellers
For most units it's not necessary to PMIX map every product or every POS button. We want you to use your time efficiently and try to focus on the things that are actually driving your food costs so you can get greater visibility into those items. For example, on the product side, dried thyme probably doesn't need to be the first thing to be mapped. Similarly, on the POS button side, that side of whipped cream is not driving your food costs, so it's not a priority to map that button. As you're starting out, we recommend you:
- Map your high value inventory product items (usually proteins). We list those for you in order in Total Purchases Mapped.
- Map your top sellers. We list those for you in order in Totals Sales Mapped.
You can use these two links at the top to help filter down to quickly find a good place to focus your energy. The "View Unmapped Sales" link will show which POS buttons have been pushed/sold but are not PMIX mapped. The "View Unmapped Purchases" link will highlight which products have been purchased in the date range but are not mapped.
Alcohol
Another option for somewhere to start is your alcohol. These do not generally require a recipe so can be done even before you've created your food recipes for some quick results. The links below give you more details on this.
Once you've completed some PMIX Mapping, you are ready to see your Theoretical Usage reporting. For more info, check out How do I see my Theoretical Usage.